Workspace Monitoring
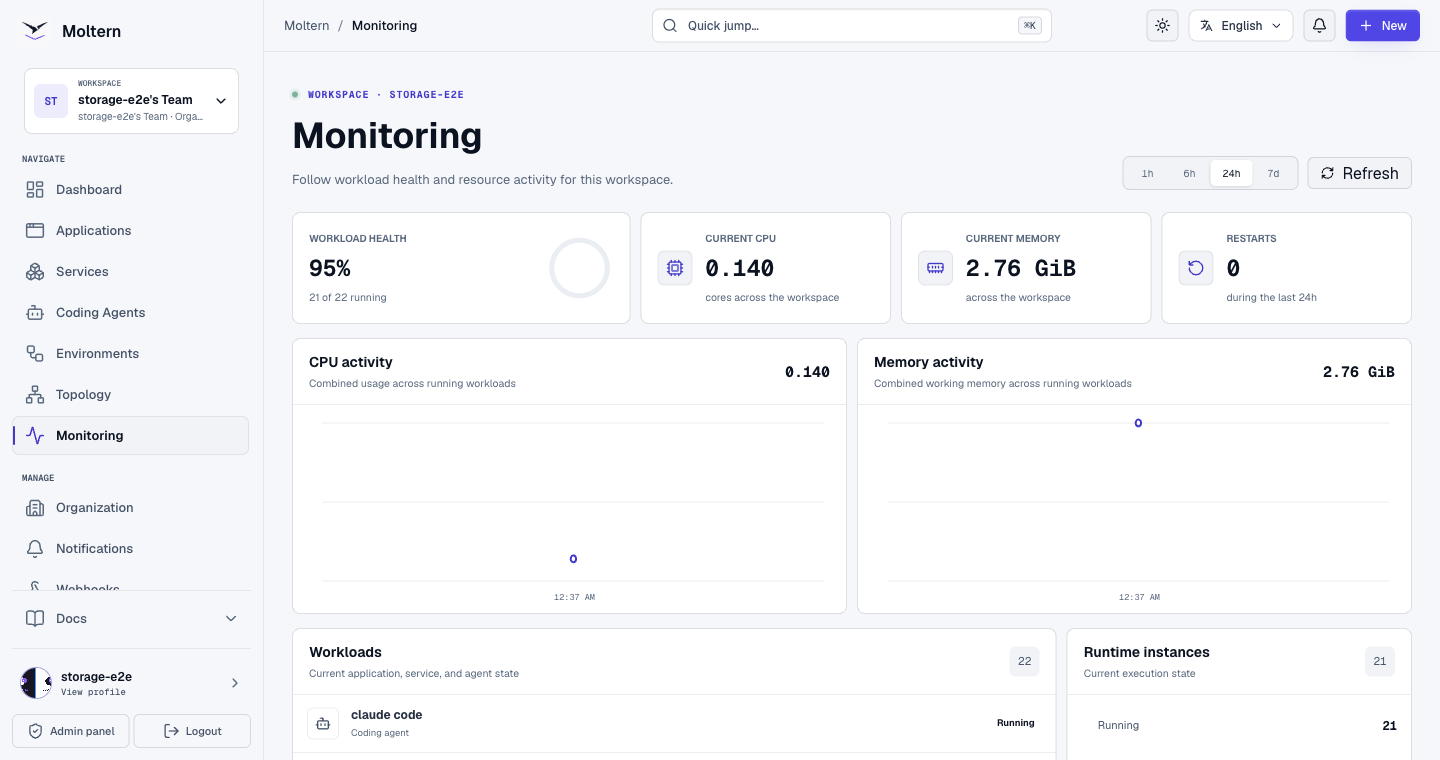
Monitoring gives your team a workspace-scoped operational view of applications, services, and coding agents. It helps answer three questions quickly:
- Is the workspace healthy now?
- Did CPU or memory activity change recently?
- Which workload needs attention?
Open Monitoring from the workspace navigation. Choose 1h, 6h, 24h, or 7d to change the time range.
What You Can See
| Area | What it shows |
|---|---|
| Workload health | Running, deploying, failed, and inactive workload totals. |
| CPU activity | Combined CPU use for running workloads in the workspace. |
| Memory activity | Combined working memory for running workloads. |
| Restarts | Runtime restarts during the selected period. |
| Workload list | Current status for each application, service, and coding agent. |
| Runtime instances | Current execution-state totals. |
Select a workload from the list to open its detail page. Use its logs and recovery guidance when a workload is failed, crashing, or deploying longer than expected.
Data States
Monitoring distinguishes a measured zero from unavailable data:
| State | Meaning |
|---|---|
| Available | Resource samples are current. |
| Partial | Some resource series are delayed; available values are still shown. |
| Unavailable | Live resource samples cannot be read temporarily. Workload status remains available. |
| Preparing | Resource monitoring is not ready for the workspace yet. |
| No data | The selected period contains no samples. This is not treated as zero usage. |
The Billing page remains the source for billable usage and plan allowances. Monitoring charts are operational signals and do not replace billing records.
Access And Isolation
Monitoring follows organization and workspace roles. Organization owners and admins, workspace admins, developers, operators, and viewers can inspect a workspace they are authorized to enter. Restricted guests do not receive the workspace-wide monitoring capability.
Every query is generated and scoped by Moltern. The page does not accept raw infrastructure queries and does not expose internal credentials, resource names, or another workspace's data.
Troubleshooting
Resource charts are empty
- Confirm that the selected range includes a period when workloads were running.
- Check the data-state message above the summary.
- Refresh after the collection interval.
- Open the workload detail page to confirm its current status.
A workload is failed
Open the workload from Monitoring, review its live or deployment logs, follow the recovery guidance, and retry only after correcting the reported cause.
The page is not in navigation
Ask an organization or workspace administrator to check your assigned role. Restricted workload-only access does not include workspace-wide monitoring.