Dashboard Navigation
The dashboard is the operational starting point for a Moltern workspace. It is built for quick scanning: what is running, what changed recently, and what needs attention.

Main Areas
| Area | Purpose |
|---|---|
| Workspace context | Shows which workspace you are operating in. |
| Summary cards | Count environment groups, applications, services, and workloads needing attention. |
| Workload filters | Filter the table by all, apps, services, failed, deploying, or stopped. |
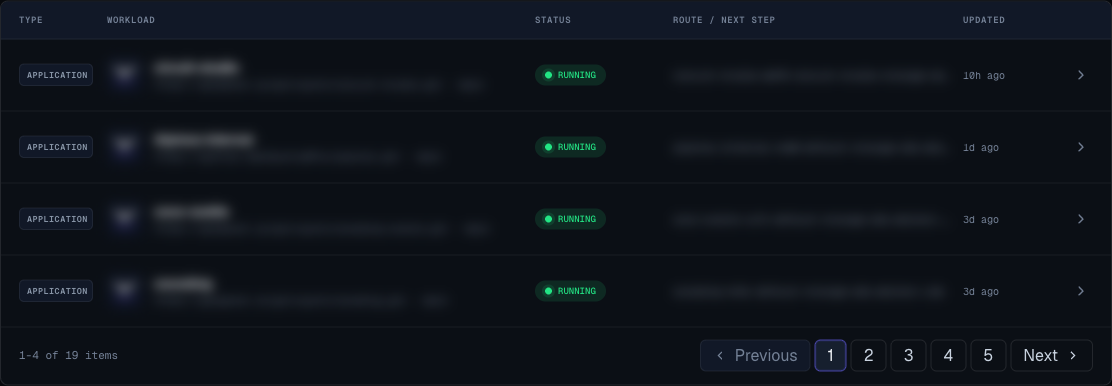
| Workload table | Lists each app or service, status, route or next step, and last update time. |
| Recent deployments | Shows the latest application deployment activity and links back to the app. |
| Environment groups | Shows where applications, services, and coding agents are organized. |
| Quick actions | Open environments, the service catalog, or application creation from the header. |
Status Meanings
| Status | Meaning | What To Do |
|---|---|---|
| running | The workload is live. | Open the route or continue normal monitoring. |
| pending | Moltern accepted the request and is preparing the workload. | Wait, then open logs if it remains pending. |
| deploying | A build, rollout, or setup operation is in progress. | Watch logs and avoid repeated deploy clicks. |
| upgrading | A service resize or update is in progress. | Wait until the operation completes. |
| sleeping | A hobby-plan service is paused after inactivity. | Open the service or click wake before sharing the URL. |
| stopped | The workload is intentionally paused. | Start it when needed. |
| failed | Moltern could not complete the requested operation. | Open the workload detail page and read recovery guidance. |
| crashing | An app starts but does not stay healthy. | Review logs, port, start command, and health check path. |
Workload Filters
Use the filter bar to reduce noise:
- All shows every app and service.
- Apps shows Git-backed applications.
- Services shows catalog services.
- Failed is the first stop during incident response.
- Deploying shows in-progress work.
- Stopped shows paused workloads.
Reading The Workload Table
Each row links to a detail page. The most important columns are:
- Type: application or service.
- Workload: name and source summary.
- Status: current state.
- Route / next step: URL, missing route, or recovery hint.
- Updated: when the workload last changed.
Open the row when:
- The status is failed, crashing, pending for too long, or stopped unexpectedly.
- You need logs.
- You need to add a domain.
- You need to resize the workload.
- You need to change variables or runtime settings.
Quick Jump
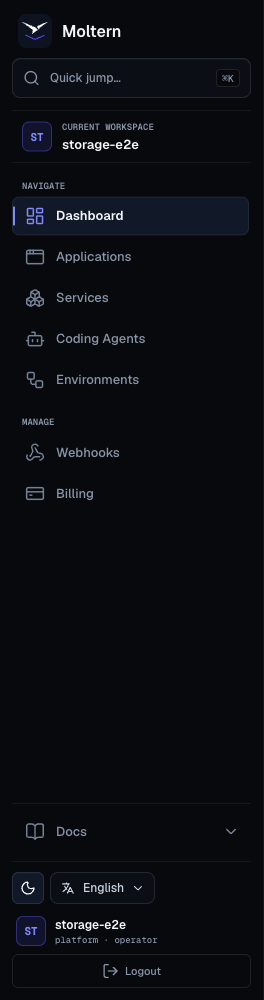
Use the quick jump field in the sidebar to move between common destinations without scanning the entire navigation. It is useful when switching between dashboard, applications, services, environments, webhooks, and billing during an incident.
Dashboard Review Routine
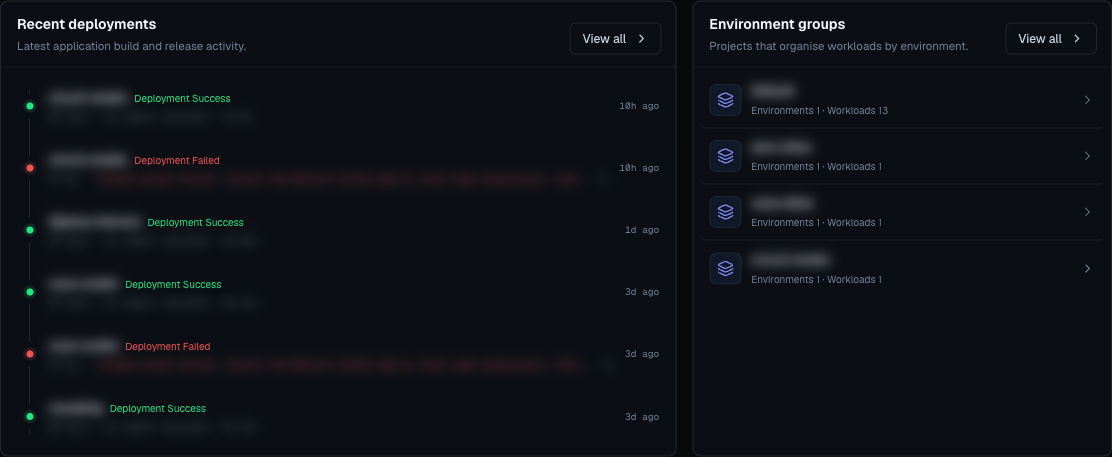
For a production workspace, review the dashboard in this order:
- Check the needs attention count.
- Open the failed filter if the count is not zero.
- Review recent deployments.
- Confirm the affected environment group.
- Confirm routes for important workloads.
- Check billing usage before starting large services or scaling apps.
- Open workload detail pages for anything that changed unexpectedly.